Kerry Close

Yakov Oskanov // Shutterstock
With the four-year anniversary of the start of the pandemic, inflation remains as relevant a topic for consumers now as it was in March 2020. While inflation in many goods and services has started to return to normal levels, cars are a notable exception: They remain significantly higher than their pre-pandemic norms and have fundamentally reset to a new baseline.
In short, the pandemic broke the traditional model of car price forecasting. In order to analyze car price affordability in the context of this "new normal," CoPilot created a Car Price Index report. This index looks at current used car prices compared to the replacement cost of a comparable new car (rather than along a historical depreciation curve).
Due to supply issues and increased production costs, new car prices became structurally more expensive during the pandemic. Over time, these increases trickled into the used market, also bringing these prices up substantially:
New cars
Average price (March 2020): $38,408
Average price (March 2024): $49,447 (29% change)
Used cars
Average price (March 2020): $23,691
Average price (March 2024): $31,556 (34% change)
While the bad news for consumers is that car prices are fundamentally more expensive than they were pre-pandemic, the good news is that there still are deals to be had within this new band of car prices – which this index will track over time.
The pandemic fundamentally broke the car market and shattered long-held assumptions of the industry and car shoppers alike. Car prices are now more expensive in a structural and long-term way. For instance, there are far fewer vehicles now listed below the traditional affordable benchmarks of $30,000 for new cars (12% in 2024, a drop from 38% in 2020) and $20,000 for used cars (30% in 2024, a drop from 53% in 2020).
This shift in the market was first caused by increases to new car prices. These surged during the pandemic for several reasons:
- Over the past four years, supply chain disruptions and chip shortages resulted in approximately 10 million fewer cars being produced compared to pre-pandemic norms.
- Once vehicle production resumed at a more typical rate, the cost of components and labor had significantly increased – and cars are now more broadly built with high-cost safety and technology features.
- There are higher profit expectations by dealers and manufacturers after nearly four years of elevated prices.
These factors have created a ripple effect: Due to new car supply issues, which reached their most severe levels in 2021 and 2022, used car supply still remains below pre-pandemic levels. This has kept demand consistently high over the past four years and limited the amount that used car prices – historically a depreciating asset – can actually decline.
Previously, used car prices moved on a depreciation curve (according to the age-old truism, a car would lose 10% of its value once you drove it off the lot). Therefore, in order to analyze the value of a used car, consumers would compare it to its original listing price and look at how much it had depreciated over time.
Now, used car prices are substantially elevated because the new car price increases seen during the pandemic have trickled through the market. Because used car prices have generally not depreciated, a new basis has emerged for consumers to evaluate the value of a used car – the current price of a comparable new car (its replacement cost).
- Currently, the average used car is worth 63% (or 63 cents on the dollar) of the cost of a comparable new car.
- For comparison, in March 2020, using the historical depreciation curve, the average used car was worth 58% (or 58 cents on the dollar) of its original listing price.
CoPilot's Index will analyze car price affordability in the context of this new normal. And though prices are structurally elevated, there is finally some good news on the horizon for consumers. This month, new car inventory has reached its highest levels since the spring of 2021. Consequently, prices have started to soften somewhat from peak levels, and we can expect them to drop further in 2024 as dealers increasingly offer incentives to move cars off their lots.
Moving forward in this new band of elevated prices, this first index report and subsequent versions will offer data and insight on:
- Current new and used car prices – broken down by make type, segment, and brand
- Changes seen in new and used car prices over time
- The current replacement cost of a used car, and how it compares to a used car's value in 2020 along the historical depreciation curve

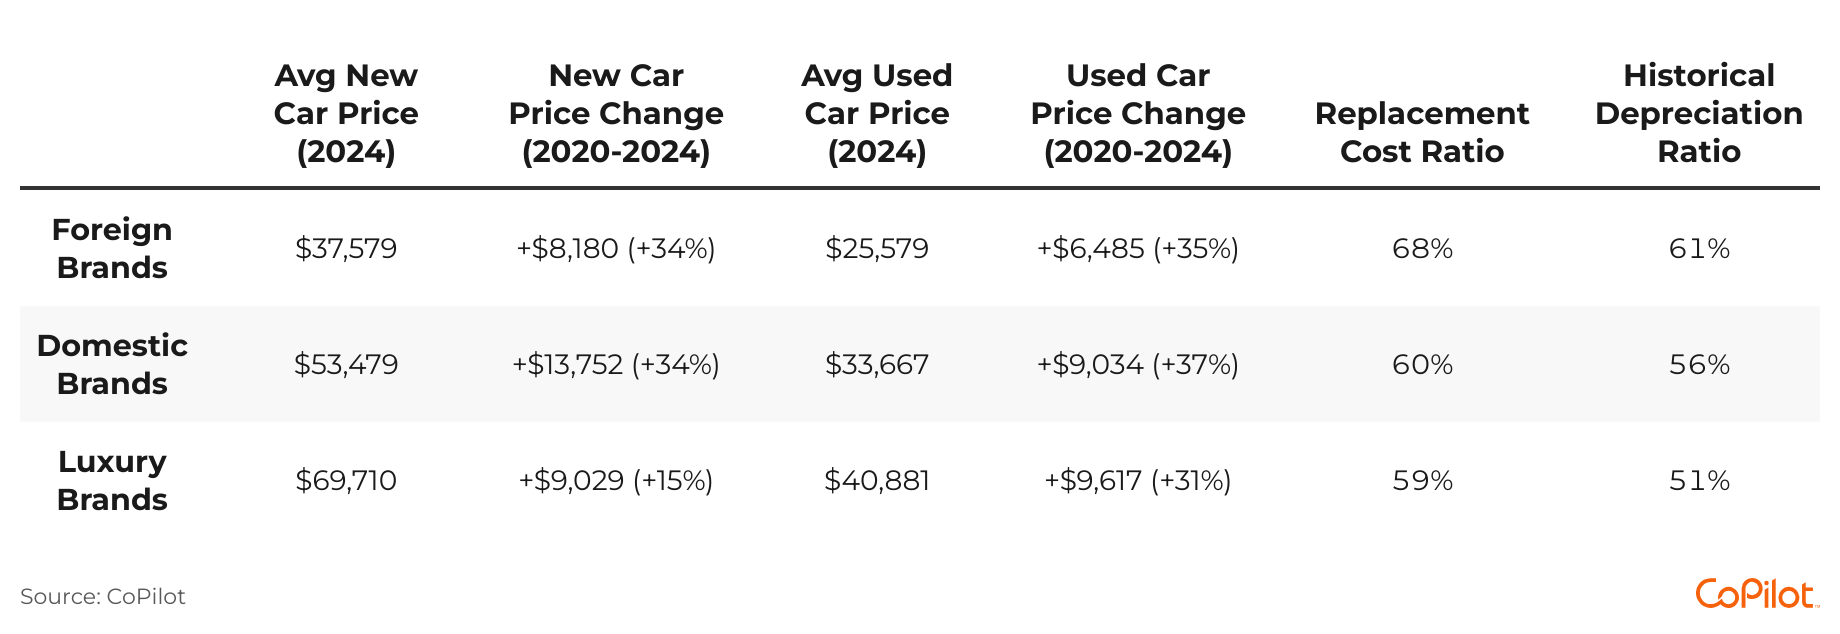
Make Type
CoPilot
Key Takeaways
- Used luxury brand cars have the highest relative replacement cost among all make types. They are worth just 59% (or 59 cents on the dollar) of a comparable new model.
- This means that their used models offer the most value to consumers: The cost of buying a comparable new model is significantly higher.
- Similarly, used domestic brands are worth just 60% (or 60 cents on the dollar) of a comparable new model.
- However, in 2020, used luxury brands had the lowest historical depreciation ratio (at 51%, or 51 cents on the dollar of their original listing price). That means that used luxury cars retained their value the least among all make types.
- Foreign brand cars have the smallest relative replacement cost among make types: They are worth 68% (or 68 cents on the dollar) of a comparable new model.
- This means that the price of a used foreign car is closest in relative terms to that of its new counterpart – and means that the price of this make type is the most inflated.
- In 2020, foreign brands had the highest historical depreciation ratio (at 61%, or 69 cents on the dollar of their original listing price). This means that their used models retained their value the most over time.
- Among foreign brands, Toyotas are a prominent example of a brand that saw significant inflation during the pandemic:
- Between 2020 and 2024, new Toyota Tundras jumped in price by 42% ($19,249).
- Between 2020 and 2024, new Toyota Sequoia prices increased by 25% ($15,946).
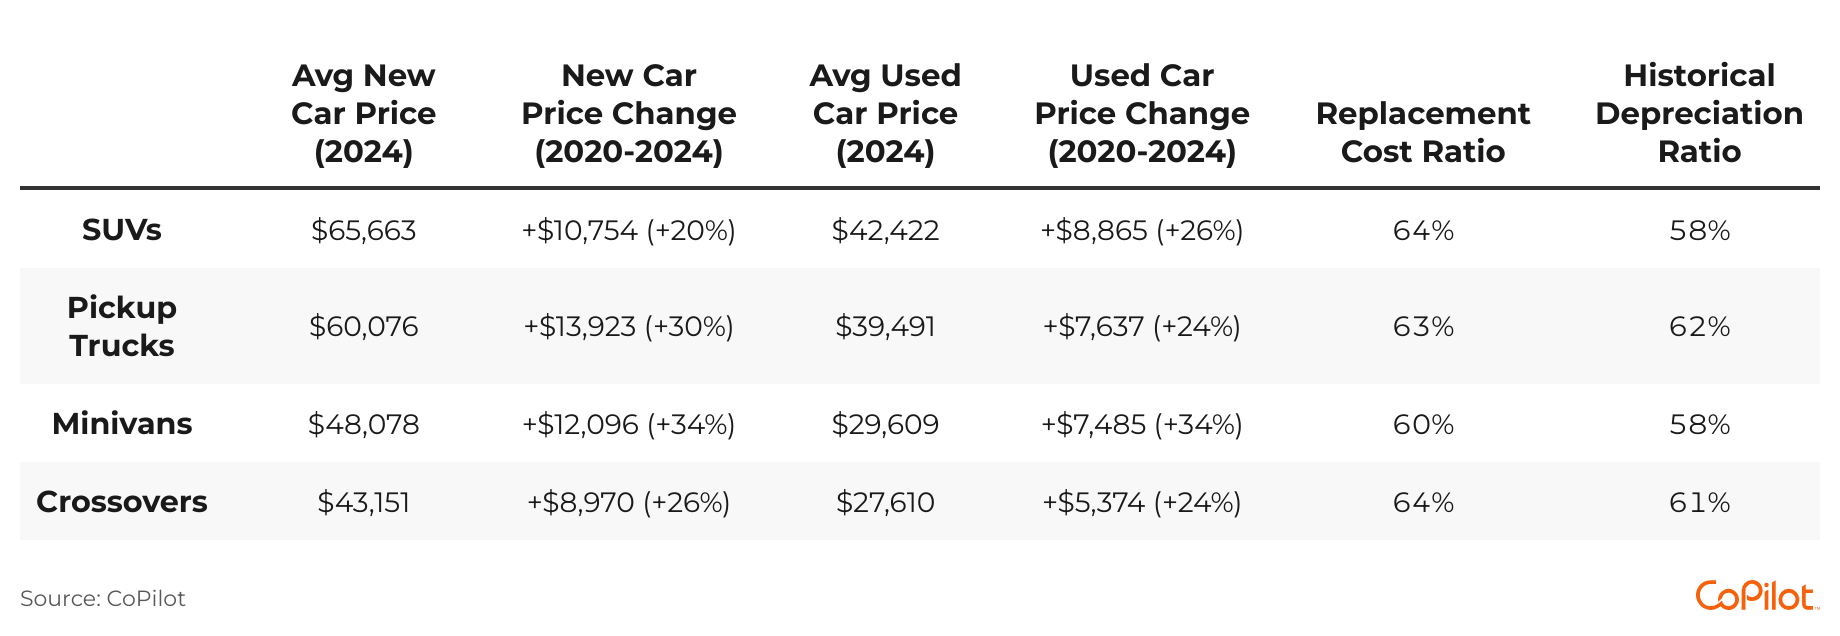
Segments
CoPilot
Key Takeaways
- Used SUVs and crossovers have the highest replacement cost ratio of all segments, worth 64% (or 64 cents on the dollar) of a new car. This means, among all segments, their used price is closest to the cost of a comparable new car.
- SUVs and trucks both saw a strong degree of inflation during the pandemic:
- For SUVs:
- New Dodge Durango prices increased by 55% ($22,762) between March 2020 and March 2024
- New GMC Yukon prices are up 28% ($18,025)
- New Chevy Tahoe prices are up 29% ($16,398)
- For pickup trucks:
- New Toyota Tundras led the pack in this category too, jumping in price by 42% ($19,249) over the past four years.
- New Ram 1500 prices also increased by 42% ($17,858).
- Used minivans have the lowest relative replacement cost ratio among all segments. They are worth just 60% (or 60 cents on the dollar) of a comparable new model – meaning that, of all segments, there is the greatest difference between their new and used value.
- Conversely, in 2020, along with SUVs, they had the lowest historical depreciation ratio (at 58%, or 59 cents on the dollar) of their original listing price. This means, of all segments, used minivans and used SUVs retained the least amount of their value over time.
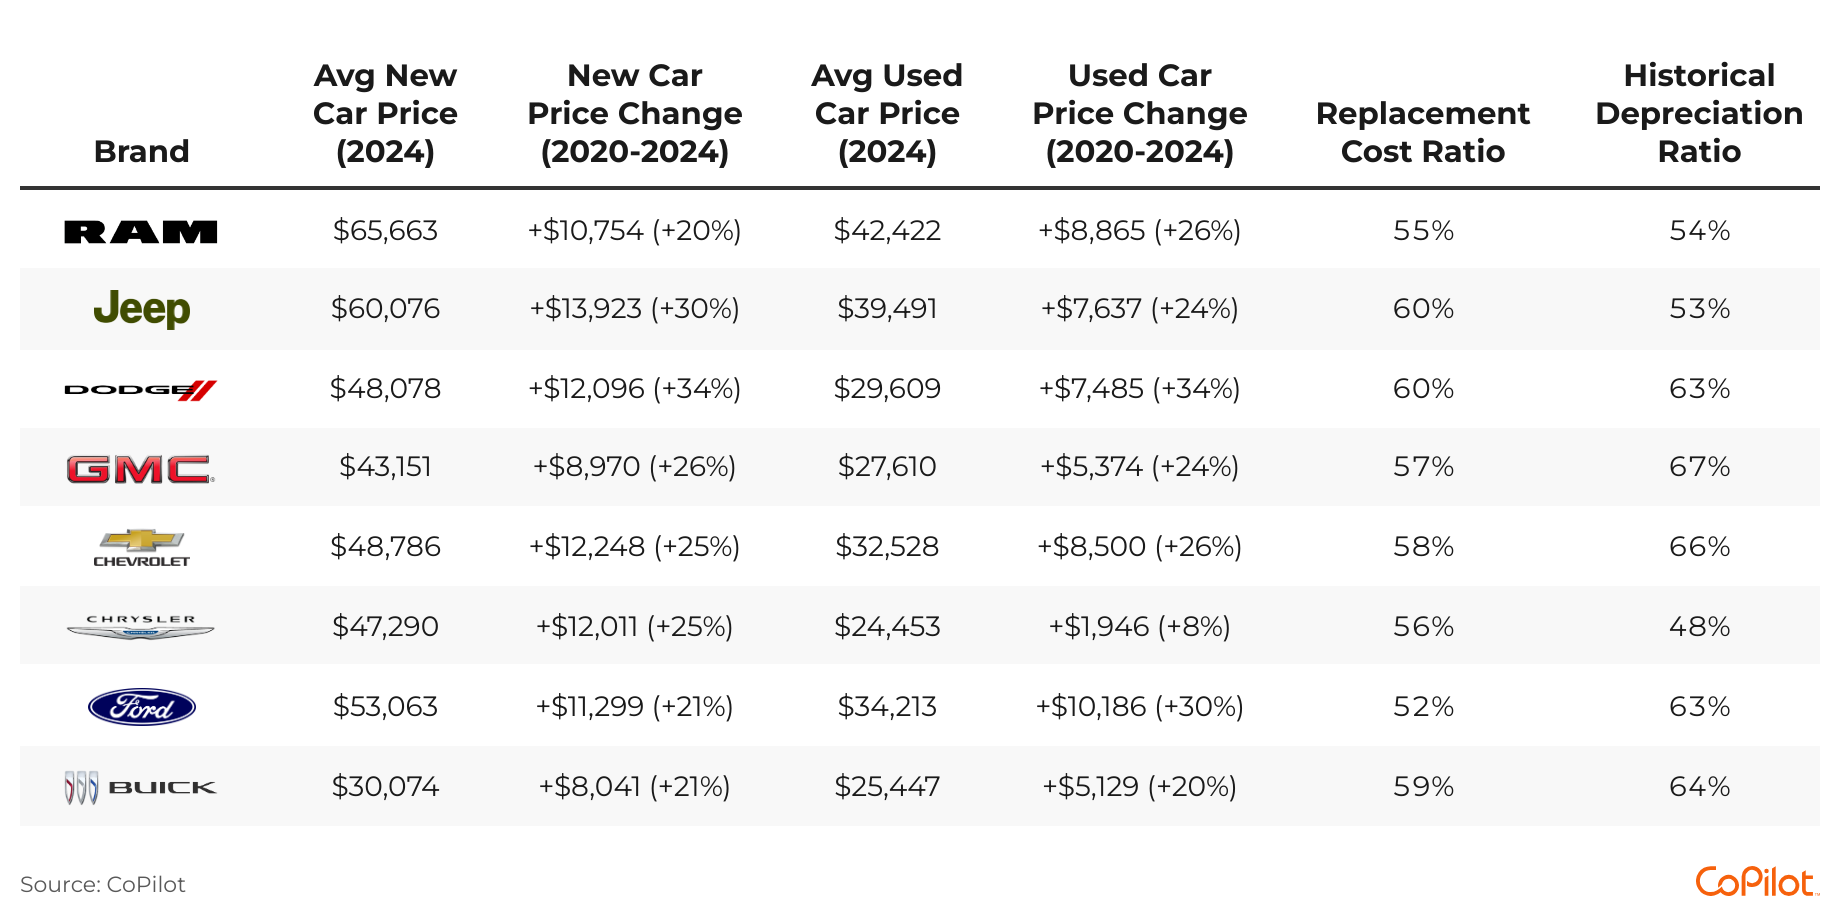
Domestic Brands
CoPilot
Key Takeaways
- Used Dodges and Jeeps have the highest replacement cost ratio of all domestic brands, worth 60% (or 60 cents on the dollar) of the cost of a comparable new car.
- This means that, among all domestic brand cars, the price of new and used Dodges and Jeeps are closest together. For consumers in the market for a Dodge or a Jeep, they may want to more strongly consider a new model.
- Dodges saw the largest inflation among its new models during the pandemic:
- In addition to the Dodge Durango (which saw a 55% or $22,762 price increase between 2020 and 2024), the Dodge Challenger also saw a substantial jump of 40%, or $14,287.
- Meanwhile, used Rams (55%), Chryslers (56%), and GMCs (57%) have the lowest replacement cost ratios of all domestic brands. This means that there is the largest difference, indicating that their used models are relatively the best buy.
- This is a change for used GMCs, which pre-pandemic held their value most strongly. In March 2020, used GMCs were worth 67% of their original listing price, the most of all domestic brands.
Foreign Brands
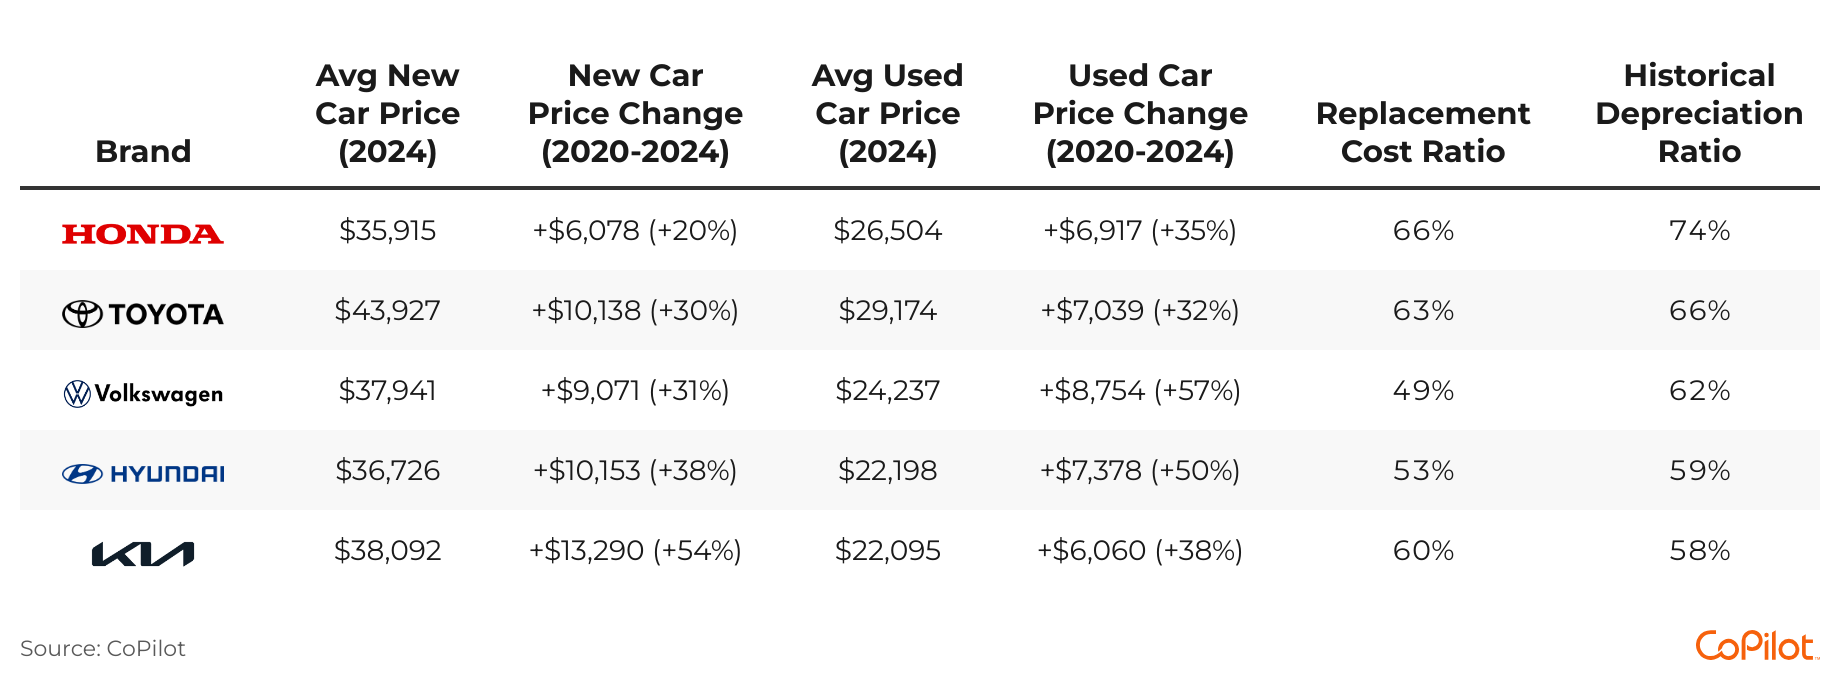
CoPilot
Key Takeaways
- Used Hondas have the highest replacement cost ratio of all foreign brands, worth 66% (or 66 cents on the dollar) of the cost of a comparable new car.
- This means that, among all domestic brand cars, used Hondas have the smallest price difference in their new and used models.
- They are followed by used Toyotas, which are worth 63% (or 63 cents on the dollar) of the comparable new car.
- Hondas saw the smallest increase in their new car prices over the course of the pandemic (up 20% between 2020 and 2024).
- Pre-pandemic, however, they held their value the most among all foreign brands: In 2020, used Hondas were worth 70% of their original listing price.
- Kias saw some of the strongest inflation to their new models during the pandemic – up 54% on average between 2020 and 2024.
- Pre-pandemic, however, Kias saw some of the largest depreciation among all foreign brands. In March 2020, they were worth just 58% of their original listing price, the lowest of any foreign brand car.
- New Kia models that have seen strong inflation include:
- the Kia Sorento, which increased by 45% ($13,275) between March 2020 and 2024
- the Kia Sportage, which increased by 34% ($8,802)
Luxury Brands
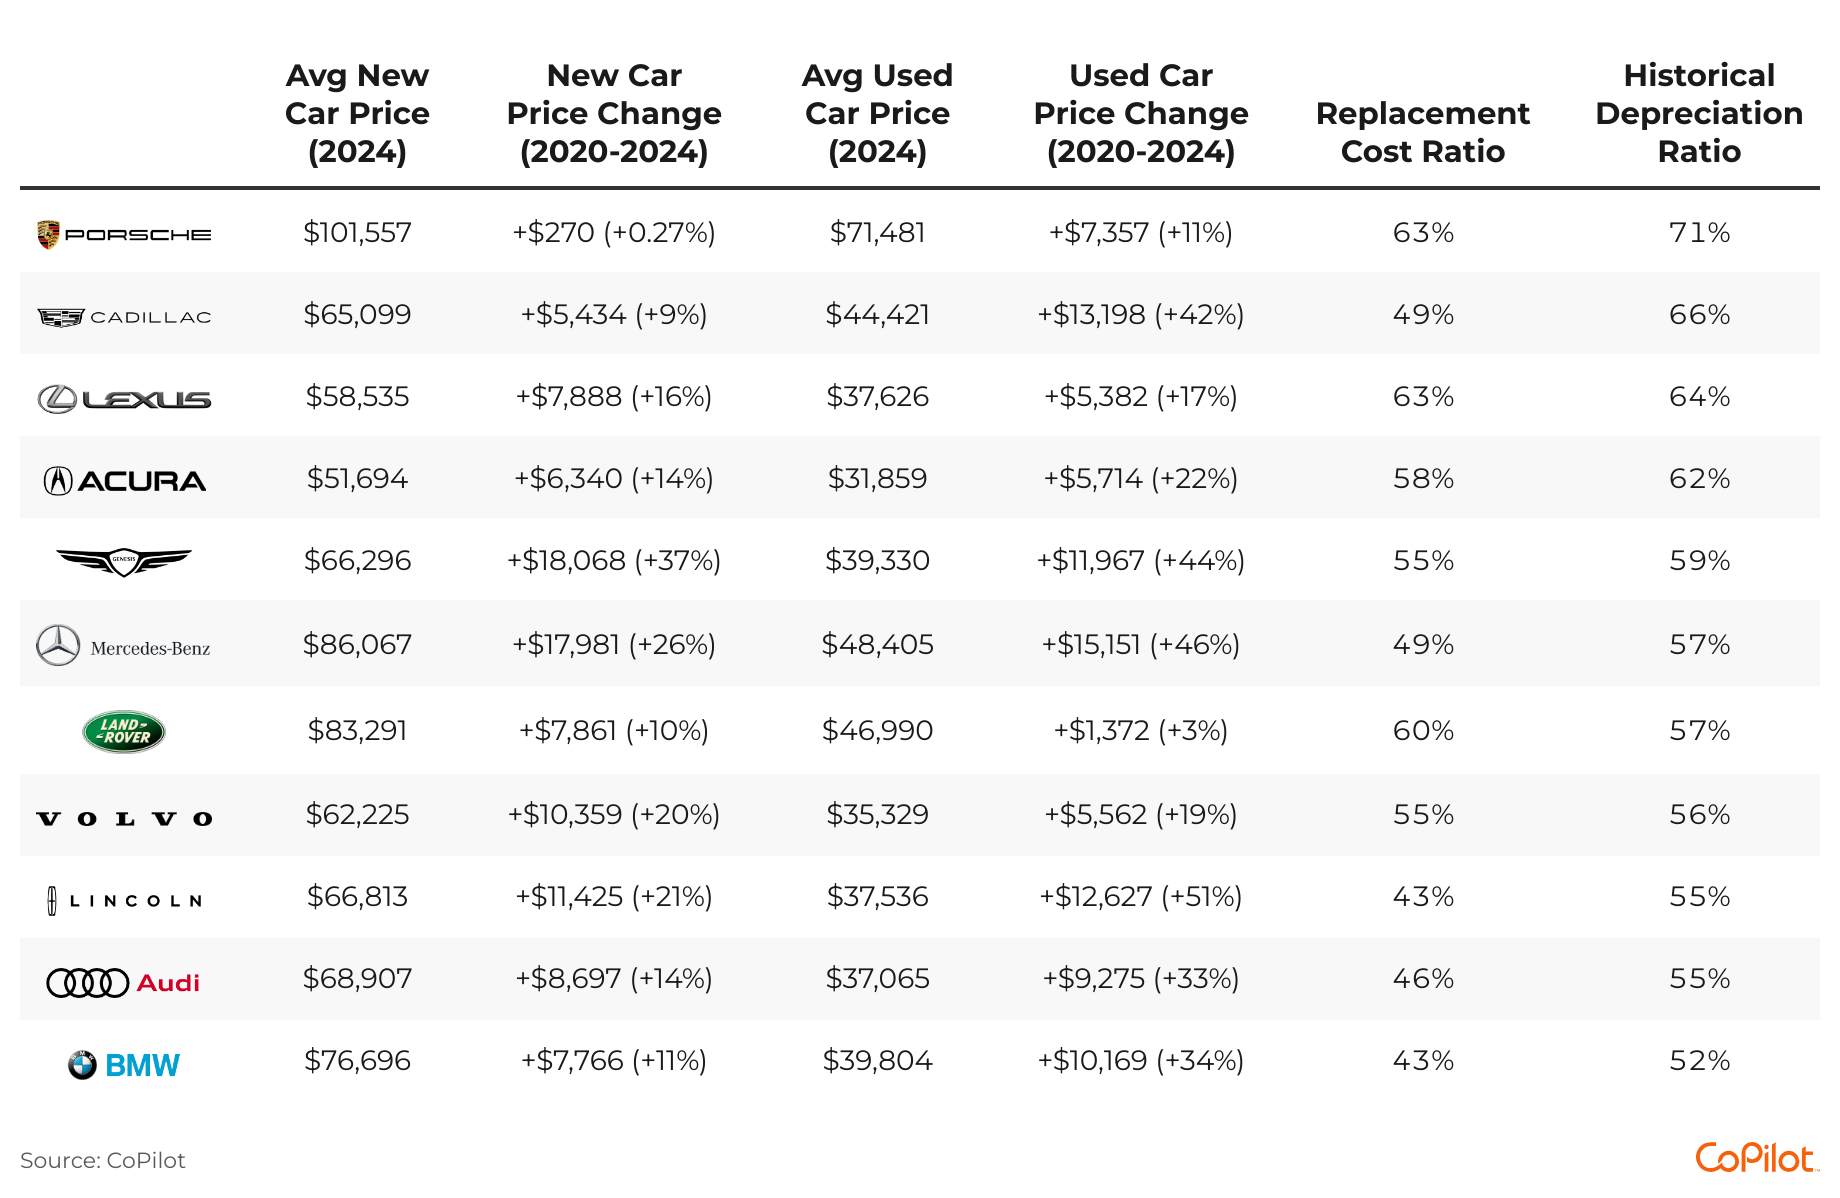
CoPilot
Key Takeaways
- Used Porsches and Lexuses have the highest replacement cost ratio of all foreign brands, worth 63% (or 63 cents on the dollar) of the cost of a comparable new car.
- This means that, among all domestic brand cars, used Porsches and Lexuses have the smallest price difference in their new and used models. This indicates that consumers interested in these brands may want to more strongly consider buying new.
- They are followed by used Land Rovers, which are worth 60% (or 60 cents on the dollar) of the comparable new car.
- Porsches saw the smallest increase in their new car prices over the course of the pandemic (up a mere 0.27% between 2020 and 2024).
- In 2020, their used models held their value the most strongly among all foreign brands, worth 71% of their original listing price.
- BMWs have the lowest replacement cost ratio, worth 43% (or 43 cents on the dollar) of a comparable new car.
- With their new models seeing just an 11% increase in price between 2020 and 2024, used BMWs represent one of the stronger values among luxury brands.
- Genesis vehicles saw the largest inflation on average among their new models during the pandemic, up 37% on average:
- Genesis G90 prices increased by 38% ($28,075) between 2020 and 2024.
This story was produced by CoPilot and reviewed and distributed by Stacker Media.